
Energy Monitoring & EMS
Turn energy data into a practical action plan.
Circuit-level monitoring, building systems context and clear performance reporting — scoped around your commercial building and the decisions you need to make.
Discuss your requirementsMeasure • Understand • Act • Verify
Find the loads behind the bill.
A monthly total cannot explain an overnight baseload, an unexpected demand peak or plant running outside its schedule. Monitoring becomes useful when readings are connected to the building, the equipment and the people who can act.
Supply-level visibility
Start with existing bills, meter records and available interval data. Establish consumption, seasonal patterns and the information already available before specifying additional hardware.
Circuit and equipment detail
Scope submetering around significant loads such as HVAC, lighting, kitchens or distribution boards. Meter selection, CT access and safe installation arrangements follow a site review.
Building systems context
Relate electricity trends to available BMS points, occupancy, temperatures and operating schedules. Connectivity and data permissions are checked with the responsible teams.
Solar alongside demand
Compare time-aligned generation, consumption, import and export data. Confirm the meter boundaries before calculating solar self-consumption or investigating a performance change.
The monitoring interval, dashboard, alerts, exports and reporting frequency are agreed for each project. “Live” visibility depends on the meter, communications link and data platform; it is not a guarantee of instantaneous or uninterrupted readings.
Engineering before analytics
Trust the readings before acting on the pattern.
Check the installation
Review CT ratio and orientation, phase association, meter configuration, communications and time settings. An incorrectly configured meter can produce a convincing but misleading trend.
Check the data
Identify missing intervals, resets, duplicate records and time misalignment. Record completeness and distinguish measured values from estimates in the reporting method.
Check the explanation
Compare a change with occupancy, weather, production or known site events. An alert starts an investigation; it does not establish a fault or prove avoidable waste on its own.
Questions your monitoring should answer
- Which loads remain on when the building is unoccupied?
- What drives peak demand, and does it coincide with plant start-up?
- Do HVAC running hours match the agreed occupancy schedule?
- Are similar sites being compared on a fair basis?
- Did an agreed operational change produce a sustained improvement?
Energy performance reporting
A report that supports the next decision.
Agree who will use the report and what they need to decide. A facilities manager needs an investigation list; a finance team needs transparent cost assumptions; a sustainability lead needs a traceable baseline and emissions method.
Building energy performance review
Illustrative report contents — no customer readings or savings are presented.
01 / Executive overview
Reporting period, sites included, principal changes, data coverage and decisions required.
02 / Consumption & demand
kWh trends, kW demand peaks, operating-hour comparisons and the monitored load breakdown.
03 / Exceptions to investigate
Timestamped events, supporting trends, possible explanations and checks for the site team.
04 / Cost & carbon method
Tariff assumptions, emissions factors, reporting boundaries and a clear separation of measured and estimated results.
05 / Action register
Each proposed action, its owner, priority, operational constraints and the evidence needed to evaluate it.
06 / Follow-up review
Before-and-after comparison, baseline adjustments, unresolved issues and the next reporting priorities.
Keep energy, demand, cost and carbon distinct
kWh — energy
The electricity consumed over an interval. Compare totals over equivalent periods and use relevant operating context.
kW — demand
The rate of electricity use. Demand peaks help identify coincident loads and scheduling opportunities.
£ — estimated cost
Use the applicable tariff and time bands. A dashboard allocation is not automatically the same as the supplier’s invoice.
tCO₂e — emissions
Apply documented factors and boundaries. Explain the reporting method and avoid treating all changes in carbon factors as operational savings.
A simple example: why overnight demand matters
A hypothetical 10 kW load left running for 10 unnecessary hours uses 100 kWh. Whether that use can safely be reduced depends on what the equipment serves. This is an arithmetic example, not a measured result or a savings promise.
Evidence for your net zero plan
Build a baseline. Prioritise changes. Verify progress.
Electricity monitoring can support a decarbonisation plan by showing where consumption occurs and whether changes hold over time. It is one part of an organisation’s wider energy and emissions evidence.
Establish the baseline
Define the buildings, meters, reporting period and available fuel data. Document operating conditions and gaps in the evidence.
Identify the opportunities
Review schedules, baseloads and plant operation. Separate operational adjustments from projects requiring design work or capital investment.
Agree a practical plan
Prioritise actions by feasibility, cost, disruption and potential impact. Assign an owner and agree how progress will be reviewed.
Measure the outcome
Compare relevant periods, considering weather, occupancy and other changes. Record the method so a trend can be interpreted and challenged.
Understand the carbon reporting boundary
Purchased electricity is generally part of Scope 2. Direct fuel use and other direct emissions need separate Scope 1 data; value-chain emissions need additional Scope 3 evidence. Electricity submetering alone cannot establish a complete Scope 1–3 footprint or certify that an organisation has reached net zero.
Supporting SECR and ESOS evidence
Structured energy records can support reporting preparation and energy assessments where these requirements apply. The applicable scope, methodology, responsibilities and any assessor requirements must be confirmed separately. Monitoring does not by itself complete or certify a regulatory assessment.
GOV.UK: environmental reporting and SECR guidance →
GOV.UK: Energy Savings Opportunity Scheme →
Single buildings and property portfolios
Start at one site. Keep the method consistent.
A monitoring scope can be developed for a single commercial building or a group of sites. For a portfolio, agree a common meter hierarchy, naming convention and reporting periods, while retaining the detail needed to explain each building.
Raw totals are rarely enough for fair benchmarking. Floor area, occupancy, opening hours, weather and activity levels may all affect the comparison. Dashboard access, ownership of the data and export requirements should be agreed at the outset.
Facilities teams
Investigate plant schedules, unoccupied-period consumption and equipment-related changes.
Business & finance teams
Review consumption drivers, clearly stated cost estimates and the evidence behind proposed expenditure.
Sustainability teams
Maintain a documented baseline, track agreed indicators and keep reporting methods traceable.
What happens when you enquire?
Review the site
Discuss the building, energy questions, existing meters, controls and access constraints.
Agree the scope
Specify monitoring points, communications, installation responsibilities, reporting outputs and review frequency.
Commission & review
Validate the readings, establish the reporting baseline and agree who will investigate findings.
Useful starting information includes your building type, location, operating hours, recent bills, available meter data and the systems you want to understand. Please do not send passwords or network credentials through the enquiry form.
Discuss a monitoring scopeEnergy monitoring questions
Can we use existing meters and data?
Possibly. We first review the available meter interfaces, historical records, permissions and data quality. Additional metering is scoped where existing data cannot answer the agreed questions.
Can this connect to our BMS or solar inverters?
Integration depends on the installed equipment, interfaces, licensing and access. Read-only data connections are assessed first; changes to building controls require a separately agreed scope.
Can monitoring guarantee a saving?
No. It can reveal patterns and help verify changes. Achievable savings depend on the baseline, the building, the actions taken and operational constraints.
Can reports be produced regularly?
Report frequency, format, data exports and any scheduled delivery are specified for the chosen system and service. We agree the required outputs before implementation.
Is this an Eco Tech software subscription?
This page describes our engineering-led monitoring and integration service. The proposed hardware, data platform, reporting arrangements and ongoing support are set out in the project scope.
School energy monitoring
More detail behind the electricity bill
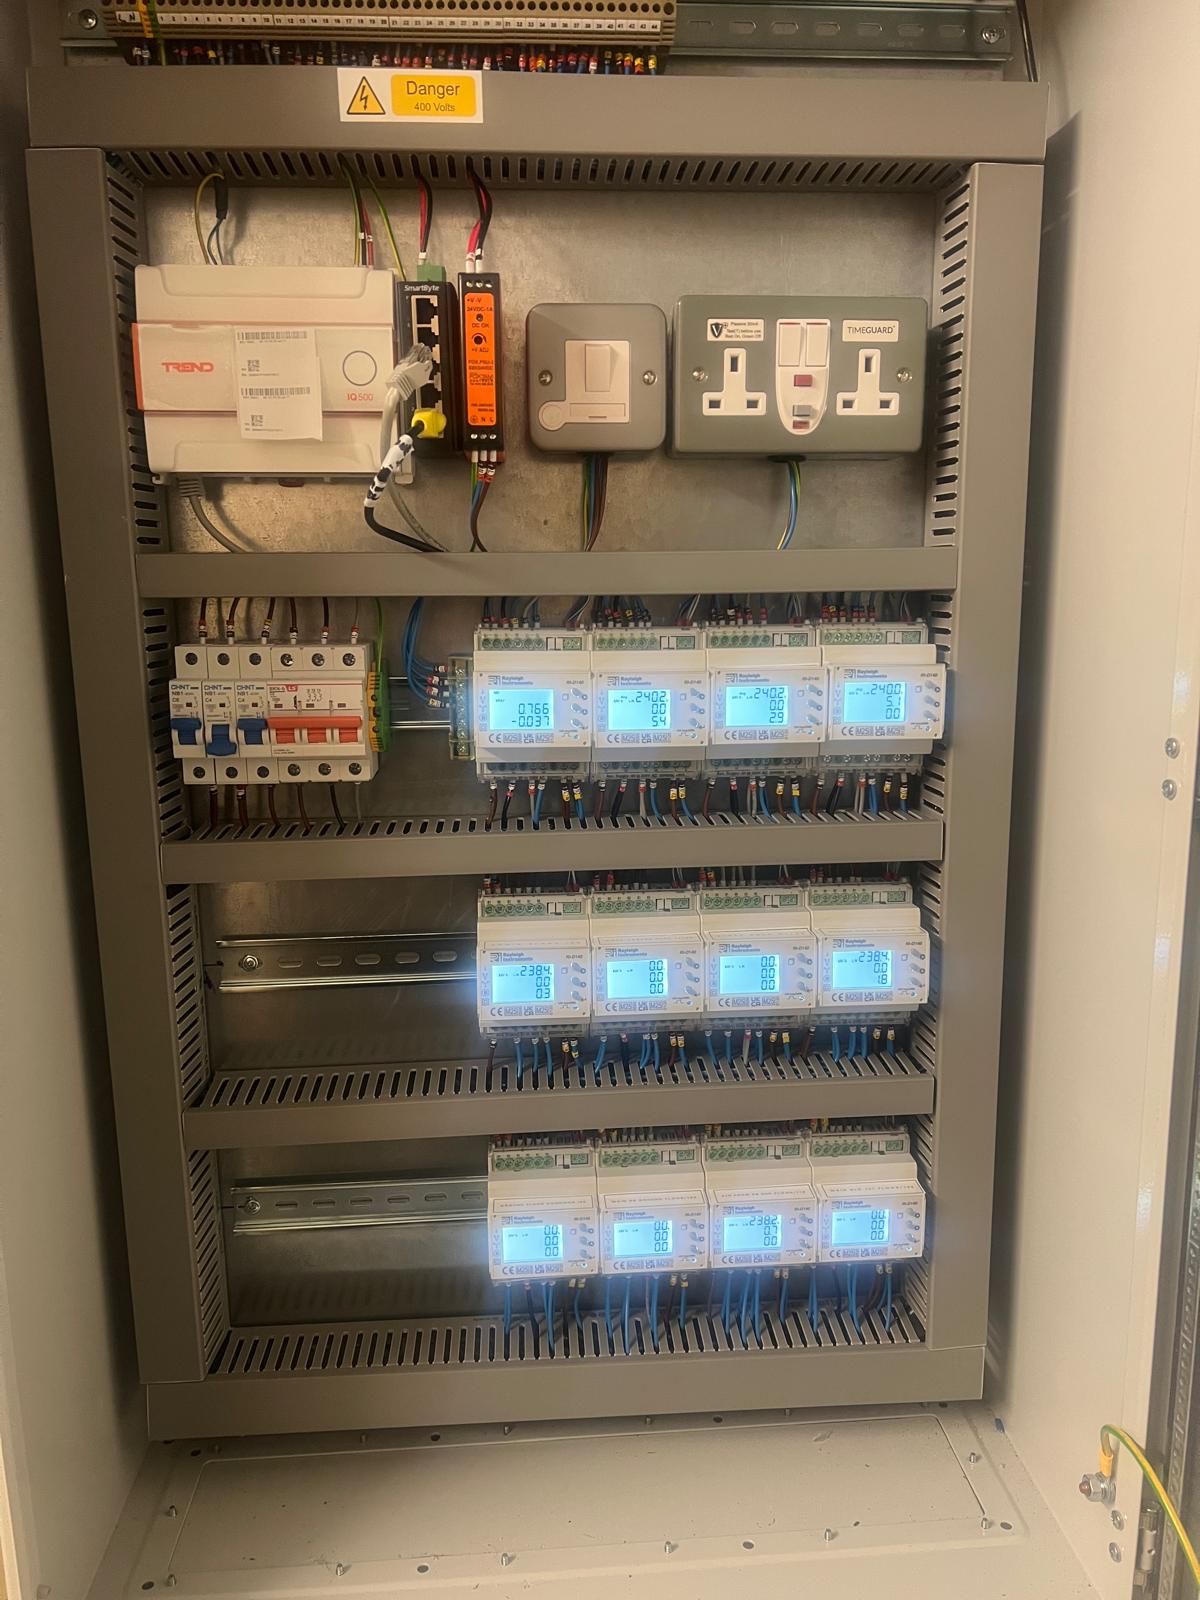
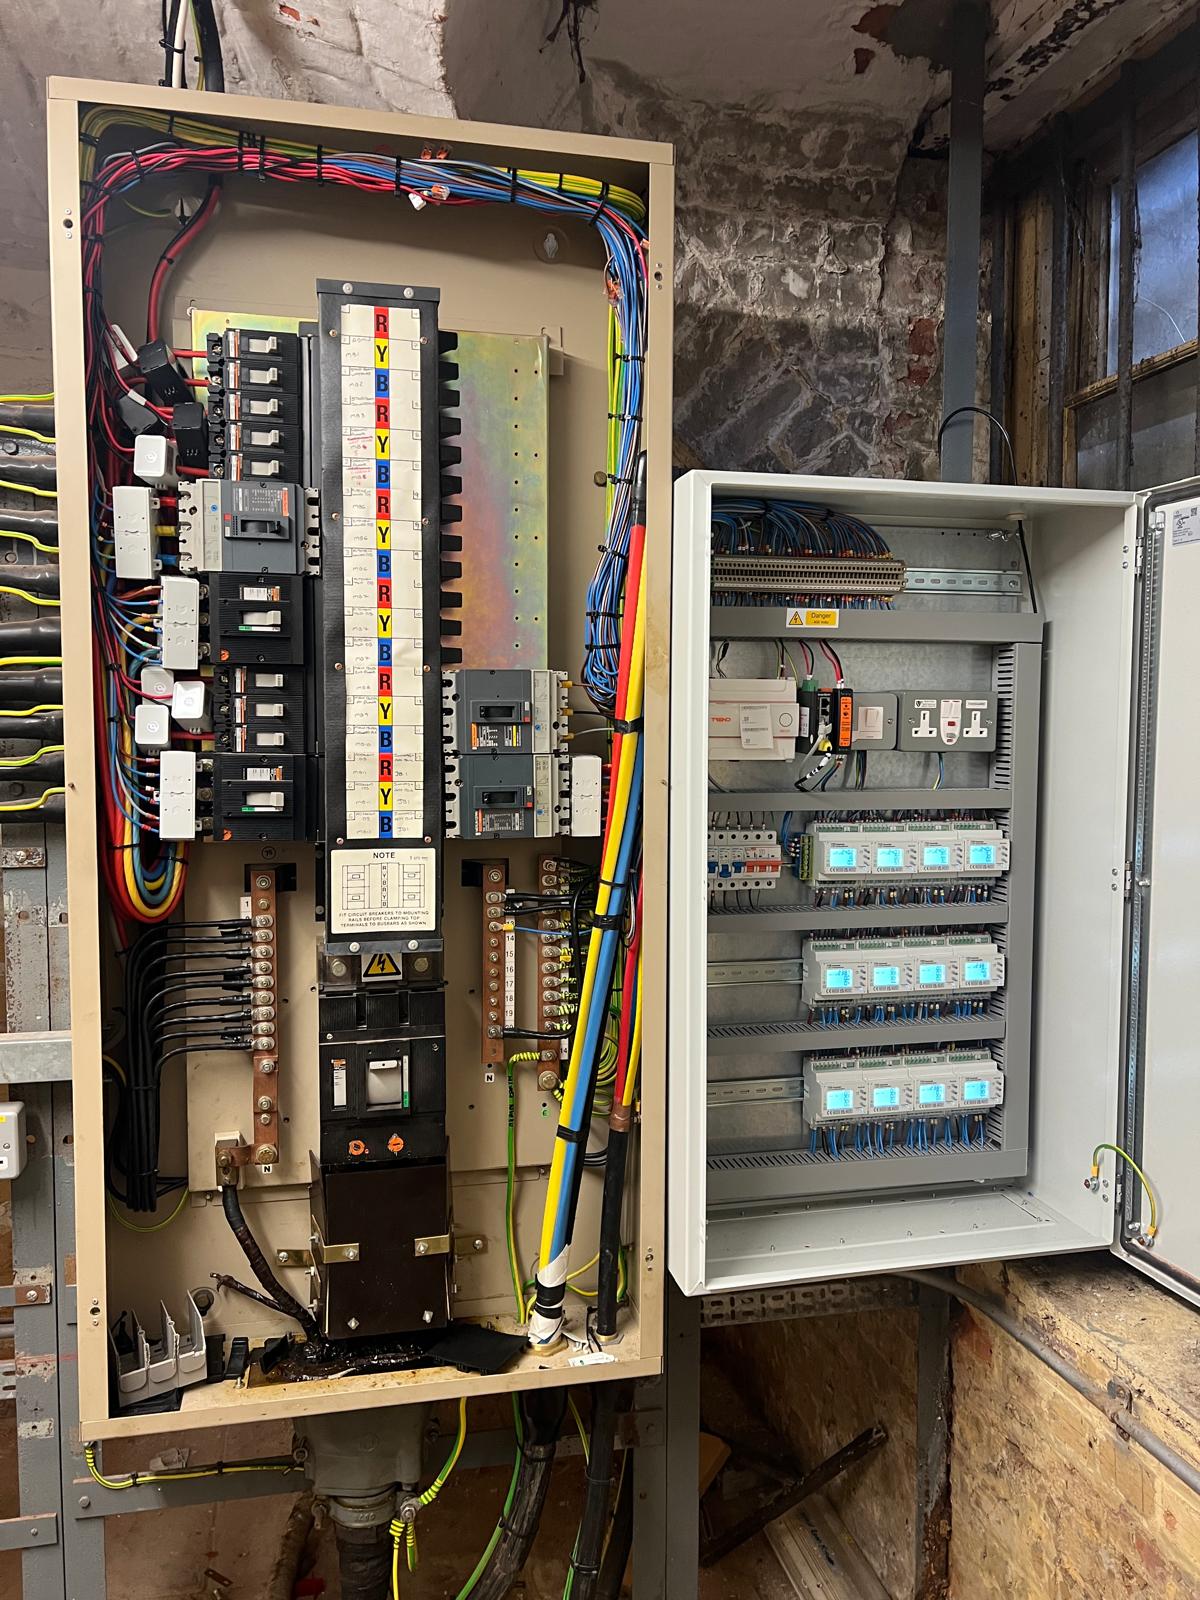
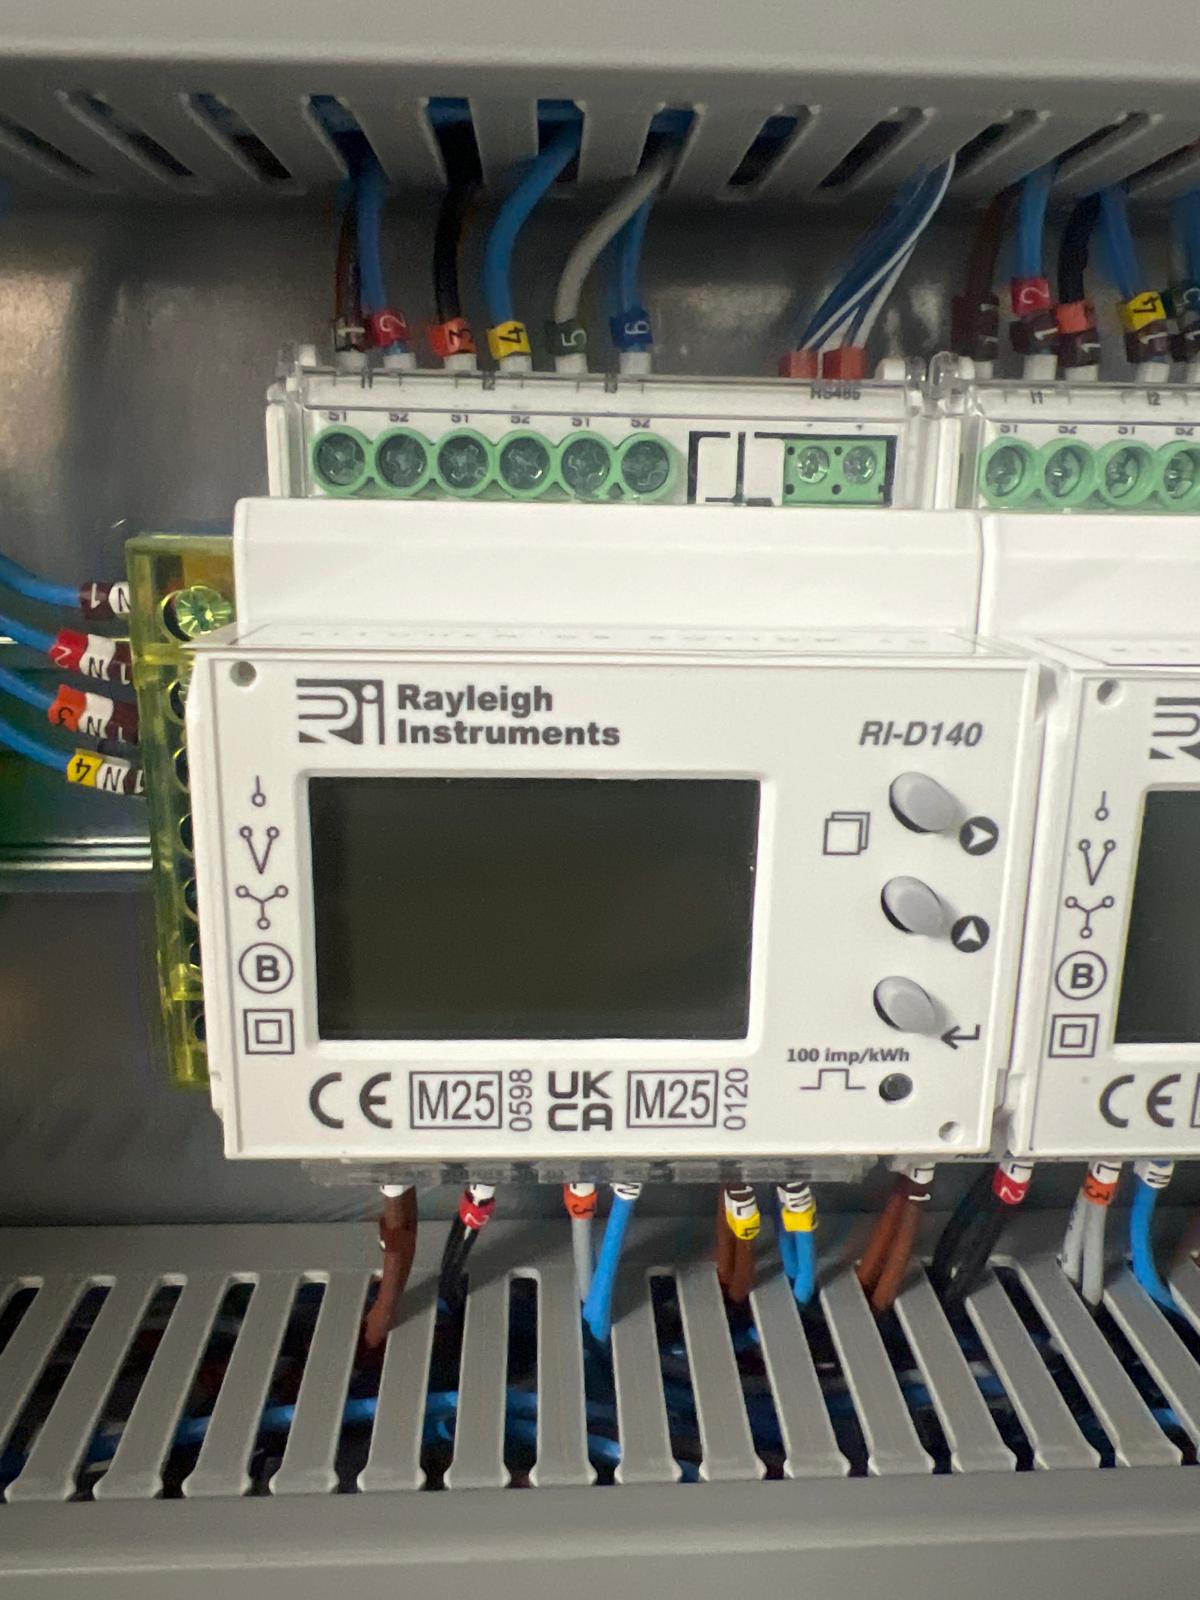
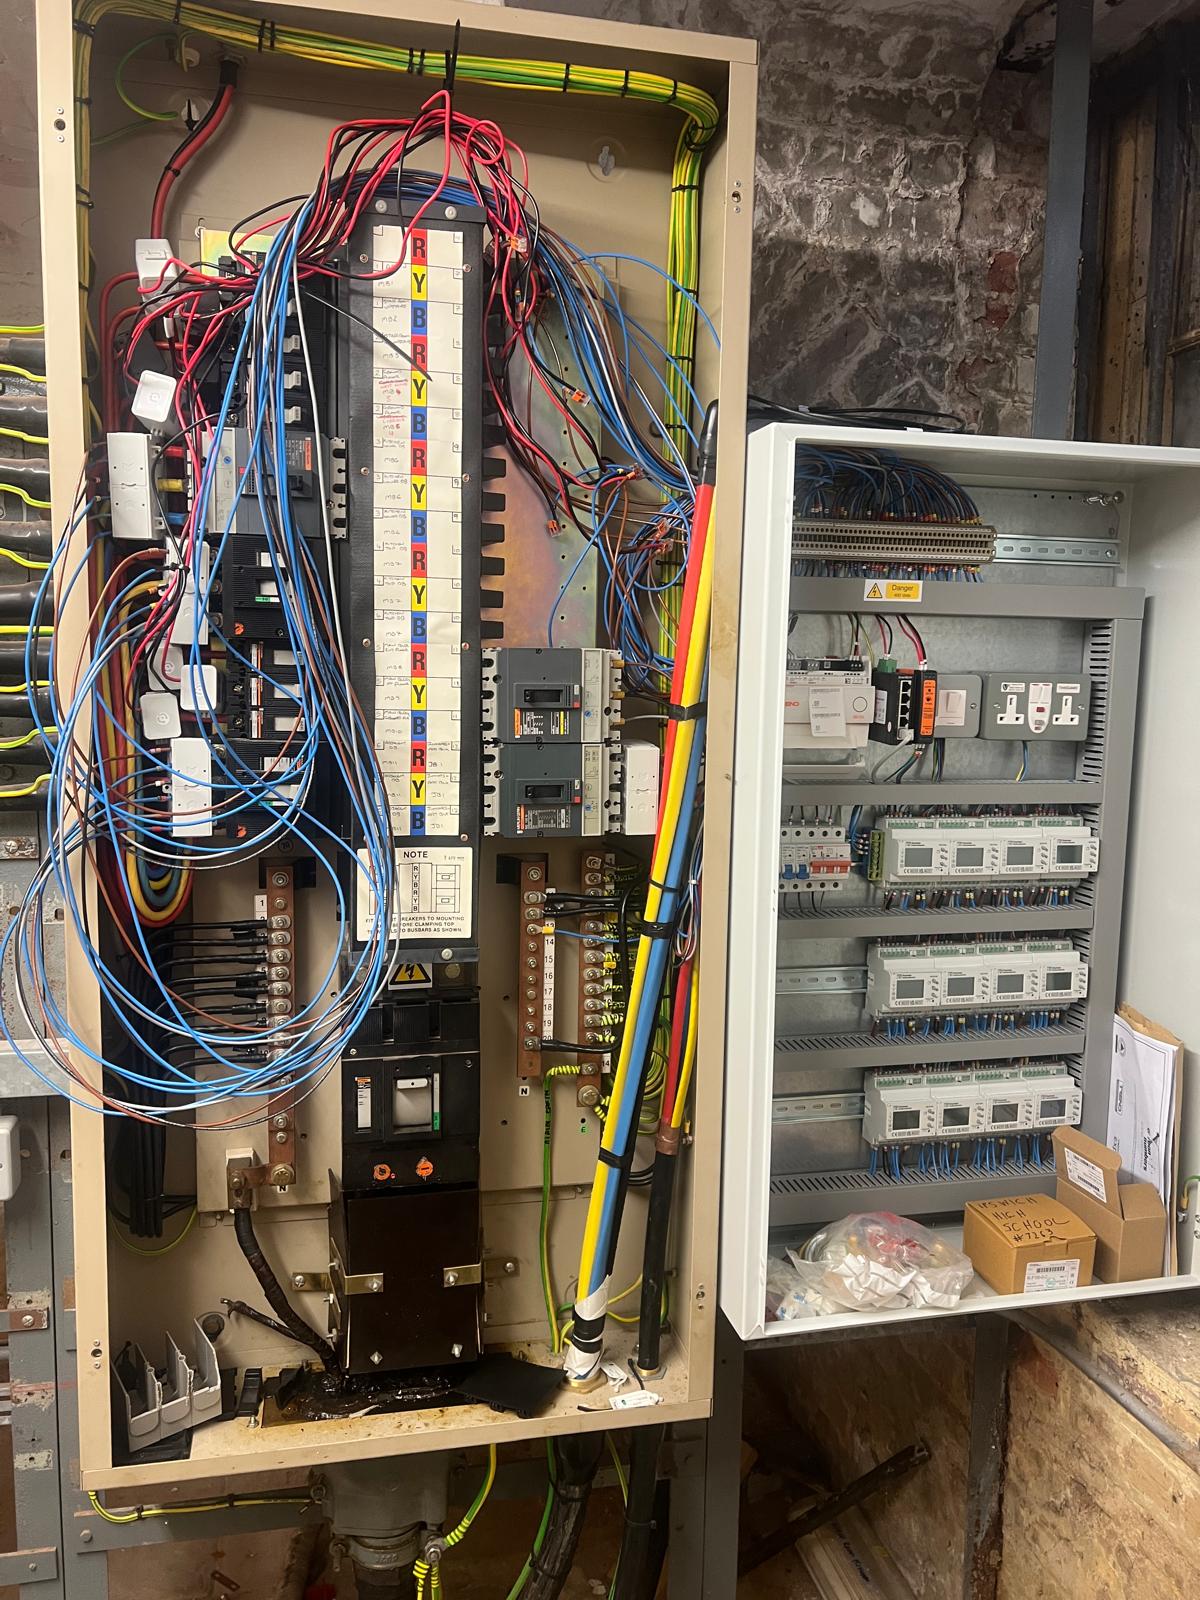
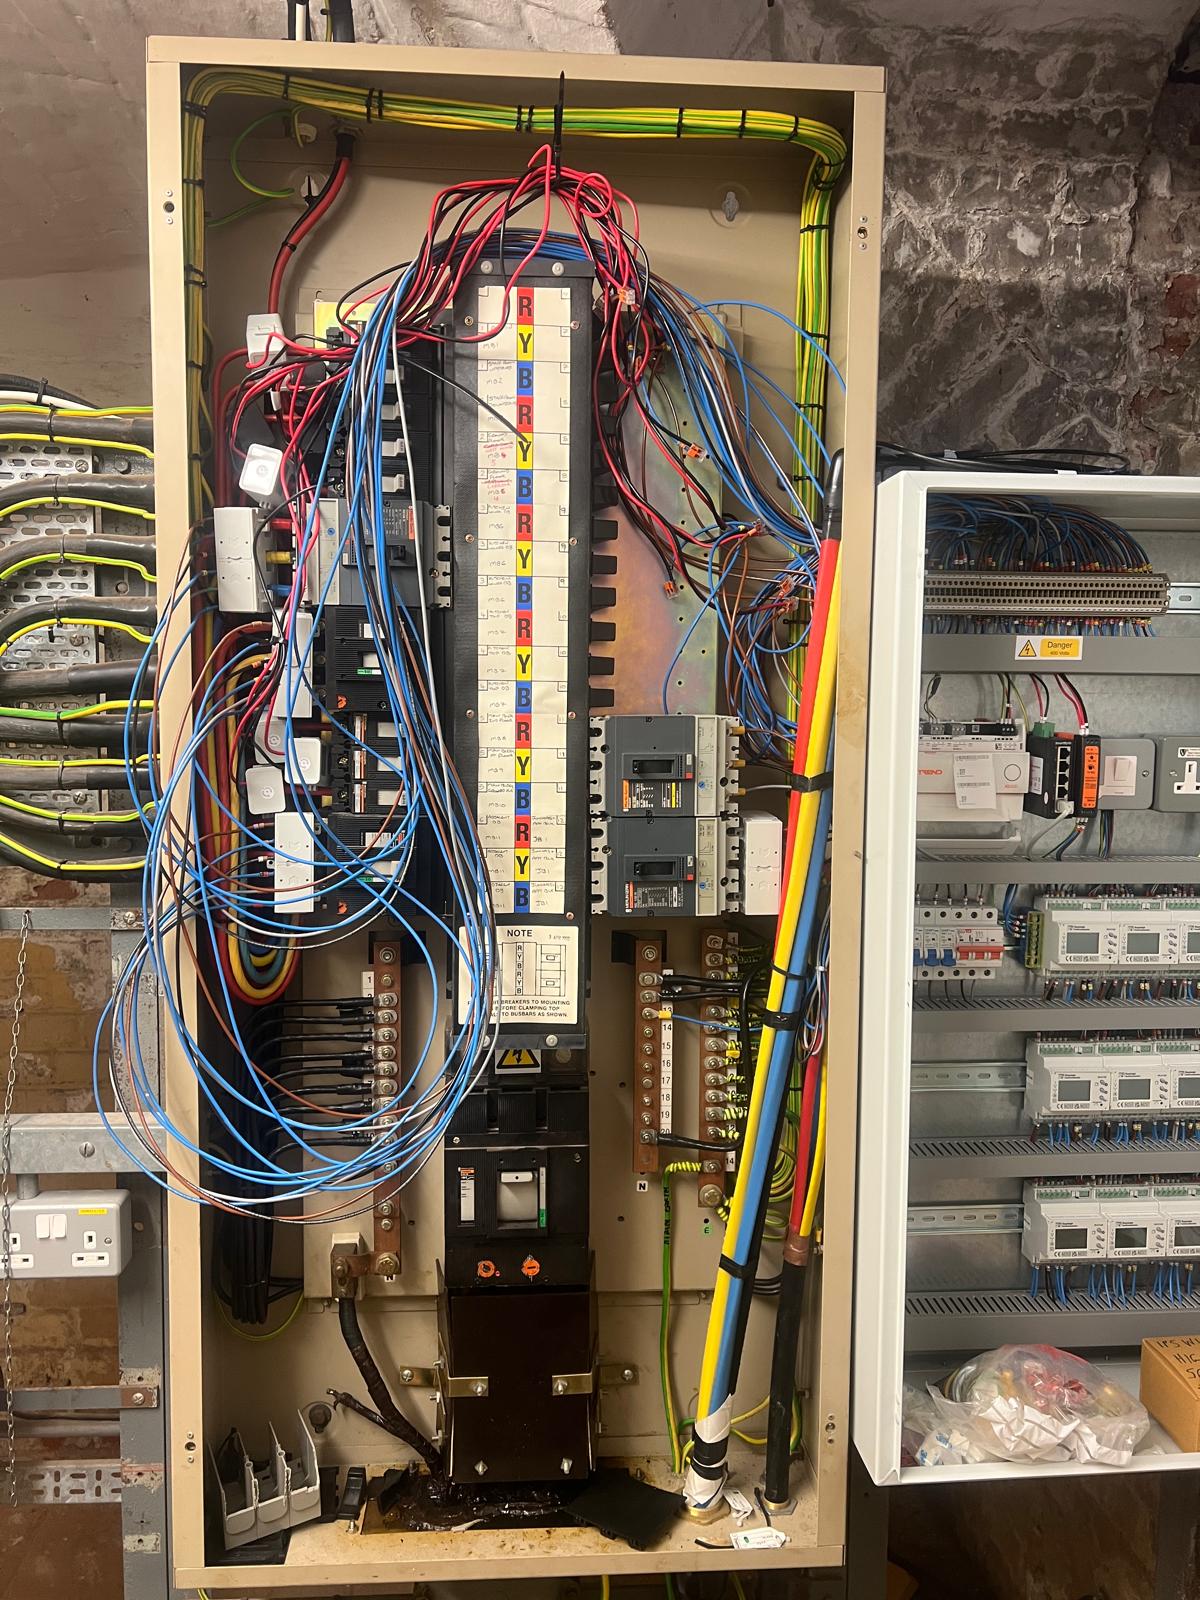
These photographs show energy monitoring work carried out at a private school. The installation was intended to provide more granular electricity consumption data for reporting and to support the school’s net zero planning.
Monitoring provides a basis for understanding usage and investigating opportunities. No verified energy, cost or carbon savings are claimed for this installation.
Official UK guidance
Use reliable data to plan practical improvements
Electricity readings in kWh help establish a baseline and track changes. Carbon reporting also needs the relevant reporting period, emissions factors and a clearly defined boundary; an electricity dashboard alone is not a complete organisational carbon footprint.
Business energy efficiency
Government advice on reviewing energy use and improving how buildings and equipment operate.
Read the government business energy guidance →UK net zero context
The UK’s national net zero target is 2050. A business should define its own baseline, responsibilities and action plan within the wider national context.
Read the UK Net Zero Strategy →Carbon reporting factors
Use the UK government’s annual greenhouse gas conversion factors appropriate to the reporting year and activity.
Find official reporting conversion factors →Department for Education: using smart meter data to understand school energy use →
Our circuit-level monitoring examples are separate from a supplier’s billing smart meter. The appropriate monitoring approach depends on the building and the questions its team needs to answer.
Discuss your building or project
Tell us about your building, existing systems and the information you need. We will help define a practical next step.
Make an enquiry